Click here for full code
suppressMessages(library(DT))
ip = as.data.frame(installed.packages()[,c(1,3:4, 16)])
ip = ip[is.na(ip$Priority),c(1:2,4),drop=FALSE]
datatable(ip,
filter = "top",
options=list(width=600),
rownames=T
)

Demetrios Papakostas
This is a Quarto book.
that’s what we’ll hopefully learn by the end of all this.
This course is based off our experience in data science.
To learn more about Quarto books visit https://quarto.org/docs/books.
Please cite:
@Manual{Papakostas2025,
  author = {Papakostas, Demetrios},
  year={2025},
  title = {Statistical machinery: data science in a post chat-gpt world},
  url = {https://normallywrong.quarto.pub/statistical-machinery/},
  note = {},
  langid = {en}
}
Papakostas D (2025), Statistical machinery: data science in a post chat-gpt world. https://normallywrong.quarto.pub/statistical-machinery/
A nice quote that isn’t related to statistics or data science, but is cool and inspiring.
To me, there are three things we all should do every day. We should do this every day of our lives. Number one is laugh. You should laugh every day. Number two is think. You should spend some time in thought. And number three is, you should have your emotions moved to tears, could be happiness or joy. But think about it. If you laugh, you think, and you cry, that’s a full day. That’s a heck of a day. You do that seven days a week, you’re going to have something special.
Jimmy Valvano
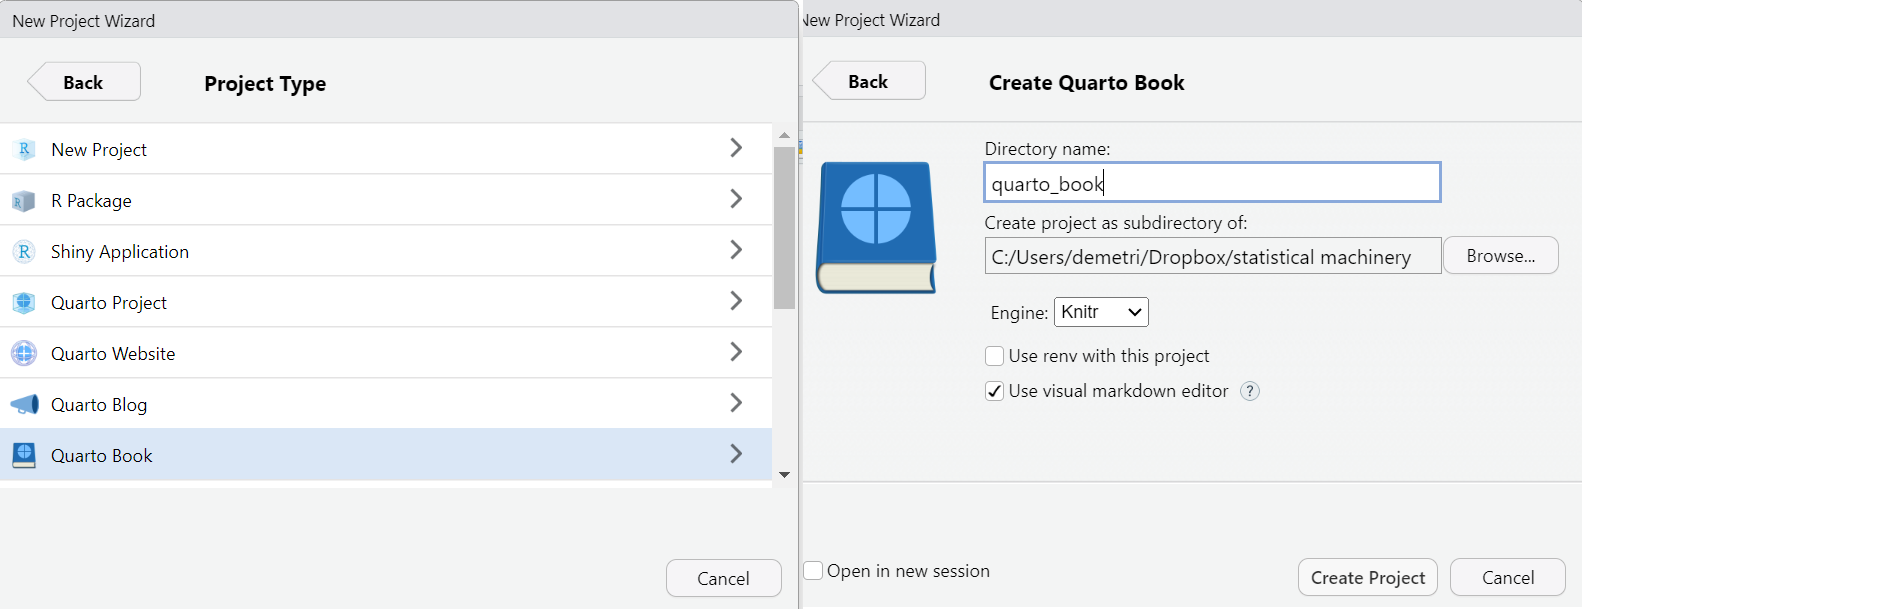
If you are running this using R-studio as your IDE, within the quarto_book create a “quarto_bookdown” folder. Then, create a new project, make it a quarto environment, and call it “quarto_bookdown” to be consistent with the notation we use.

If you are a data scientist/student/interested learner and you are in this boat: “I have some data, but I am not sure what to do with it”, then these notes are for you. Our goal is to show people how to scrutinize data, do some preliminary exploration, and be familiar with different methods used for similar types of problems. We do so through the R and Python software suites, which are both free, open source, and have many online resources for help. The goal of this course is to bridge the gap between what you learn in school and what you might encounter on the web, in media, or at work. For example, seeing a cool fivethirtyeight or New York Times model (with all the spruced up graphics and interaction) can make a college student feel ill-equipped for the world of data science as they sit in their linear algebra class1. But all these things are connected and we will try and close the knowledge vs doing gap.
1 A defining moment for me in college was realizing about three years in that I was pretty close to graduating, and I couldn’t even fathom recreating any statistical model/data analysis that I was soaking up in the beginning of the data journalism era. Not to say I did not learn a lot in college, I did, and my problem solving skills evolved, but I was just ill-equipped for data science tasks. This culminated in a “data-fest” experience in 2017 where I was a lost puppy. Taking a practical data science course in R in 2017 with Michael Posner and then preparing more thoroughly for data-fest 2018 at Villanova (with data-team 6) was a personal big win for me and helped me realize the importance of practical hands on data science.
We are structuring the notes so that different types of problems are clumped together, and hopefully sequentially build off one another. Simulations and real data examples are mixed together to build intuiton (and hopefully interest) for the reader. Assumptions, pitfalls, and computational limitations of methods are discussed in detail. Quick and dirty implementations of methods, from scratch if possible, are shown to help elucidate the material. For this reason, more bespoke softwares within python and R, such as PyTorch, STAN, PyMC, and Numpyro, among others, are avoided. These tools are excellent and will likely be used in your careers, but using them could make life “too easy” and prevent understanding at the early level.
We will also gear this book towards “applied statistics”, or “data science”. In our view, the best applied statistics is development of novel methodology for a bespoke problem2. This is easier in a sense since the proposed methodology need not always work, we just need to know where it will. Being well versed in the problem at hand affords us the ability to know when we can and cannot cut corners. However, applied problems also require dealing with real data, which you will come to recognize as your greatest bane soon enough.
2 Well, maybe not novel for every applied problem, but ideally some clever use of existing methods tailored for the task at hand.
To facilitate these goals, we are indebted to the talented team behind the stochtree project(Herren et al. 2025). Stochtree is the product of a lot of hard and vision work from Andrew Herren, Richard Hahn, Jared Murray, and others. This project is a valiant effort and will hopefully help more people have access to stochastic tree based machine learners, the most talked about models in these notes that we very strongly advocate for. Of course, we also want to strongly endorse Bayesian additive regression trees (BART) (Chipman, George, and McCulloch 2012) as the cornerstone supervised learning and causal inference tool for the modern data scientist. My wife, Samantha Brozak, also was extraordinarily helpful in compiling these notes. She is wicked sharp and provides unique insights to different modeling approaches. She is also honest enough to table poor entries and has devised many interesting and intuitive examples for tricky subjects. Thanks a bunch.
Finally, we are quick to criticize assumptions and common use cases of popular statistical methods. We also put on emphasis on making the goals of a problem clear and make sure we specify what exactly we are trying to estimate. Without doing so, erroneous results can creep into an analysis or the outputs of an analysis can be badly misunderstood by the intended audience. While we certainly have many methods & approaches we will chirp throughout these next 16 chapters, we still present situations where these methods are appropriate.
On the topics side, we avoid spending too much time on things that are “hot” right now in machine learning, such as LLMs and deep learning in general. This is mainly because there are a million and one tools for those already out there, and they are not exactly the type of statistical thinking we are trying to impart. There are also techniques that are outside the scope of this textbook. We certainly discuss them, but not in immense detail.
Here is a non-exhaustive list of topics that deserve more attention but we do not delve deeply into:
Data engineering: This role is vital. If the data scientist is squeezing out remaining insights or innovating, it is on the engineers shoulders they stand. The data engineer maintains everything and keeps the world spinning. This is extremely vital and the skills are worth the effort to learn. These include unit testing, writing properly commented code, being familiar with database structures, version control (particularly with git), command line mastery, Docker, and much more.
Deep learning: as mentioned above, many other resources are available.
Natural language processing: Nowadays, most language models are “large language models” (LLMs) built off the transformer architecture and the “attention” mechanism. We will discuss these in chapter 7, but not in enormous detail. Supervised machine learning for text analysis in R provides a great overview of more “traditional” methods (Hvitfeldt and Silge 2021).
Time series: not our wheelhouse
Spatial statistics: see time series explanation. Needless to say, spatio-temporal analyses will also not be studied in any detail.
Machine learning with physical constraints: we delve into this with “Physics informed neural networks”, and a bit with some of the suggested readings in the summary section, but this is a cool topic that will be big and important in the coming years.
Causal inference: Again, we talk about this a decent bit, and leave some references in the summary, but this is a vital tool when working in the real world, whether it be to promote experimentation, or be well adept at saying how much interventions actually mattered in an observational study. In the summary chapter, we briefly discuss some of the more accessible elements of causal inference, but omit details on causal graphs and structural equation modeling (see (Hahn and Herren 2022) for a fascinating connection between all these topics).
A/B tests: A huge area of work in the industry. An example could be displaying different web versions for users at random and seeing which drove engagement (wikipedia has a famous example of this).
Data analysis & programmatic work: we give no SQL primers (which is a vital skill) and do not clean particularly messy data. More work in quality visualizations can be found elsewhere too. Dashboarding, the backbone of a data analyst, will also be largely avoided. We also will not learn any d3.js, which can really amp your viz game. If you are interested, please use the messy package by Nicola Rennie. It will make your data messy as you might see in industry, which provides good practice for cleaning.
Data construction: a vital piece of analysis is actually collecting data, which is a difficult skill to learn and one we are not equipped to handle. We do discuss feature engineering, an important skill that is much easier said than done, as we have learned the hard way on the job. Of course, data don’t just fall into your lap, so this is an important skill to nail down.
Covariate shift/domain shift/concept drift: If the data you train on are not representative of future things you want to predict on, then you are in trouble. This is an extremely important problem, both to diagnose and to remedy. It is also very difficult to do either of these things as it requires a lot of original thought and bespoke solutions for the problems at hand.
Signal processing: this topic deserves, and has been given, a lot of attention. Major themes include Fourier transforms and peak finding algorithms. Analyzing signals is a big part of data analytics for many engineering tasks, include audio processing and observational astronomy. Shazam, the song recognition algorithm, worked off of Fourier signal analysis!
Advanced Bayesian computation tools: These include Hamiltonian Monte Carlo, filtering techniques for posterior sampling, and elliptical slice sampling, among others.
State space models and the Kalman filter: More useful in modeling that is not as common for data scientists, such as dynamical processes. However, these type of data are the future (self-driving cars for example), so stay tuned for this in a potential future chapter.
Design of experiments: This is a cool field, but more of our study is about analysis of experiments. That being said, design of experiments is extremely important and a valuable tool for a data scientist.
Survey data: We talk about techniques that are important to survey data analysis, but careers have been made about this work and other resources are available that could give more in depth background.
Panel & longitudinal data analysis: These topics are not quite the same thing, but they are vital to know if you are interested in policy work, particularly studying economic policies. A course in causal inference would be better suited to discuss these topics, which we highly recommend as a follow up course.
Survival analysis: This is a tricky subject that is difficult to do, but I believe is pretty close to a revolution with modern tools creeping in. Similarly, density regression is important but not discussed. Survival analysis studies “time to event” data and is muddied by the fact that some people never experience the event of interest (the statistical term is “censoring”), and that data is gone. As a doornail.
Density regression: This refers modeling the entire density distribution at every design point, not just the mean function. One way to do this is to model heteroskedasticity of the variance, but this still requires specify a distribution of the variance, restricting the flexibility of your approach. Typically full density regression is done through kernel density regression (or kernel weighting) or through a mixture model. We omit most details of these, but recommend for further reading.
Conformal inference: A new and exciting field, will wait to see where it heads. (Angelopoulos and Bates 2021), with arxiv link here, is a nice introduction to the field. These methods provide coverage guarantees for predictive intervals that do not rely on asymptotics, which we rarely have in practice, and do not depend on distribution assumptions.
Hypothesis testing: In our opinion, the intense focus on significance testing as a pillar of modern statistics is misguided. In addition to contributing to a lot of poor science recently, we feel that statistics would be better off with more focus on other areas, like prediction and parameter estimation. Check out this wikipedia page which does not hold any punches when describing hypothesis testing:
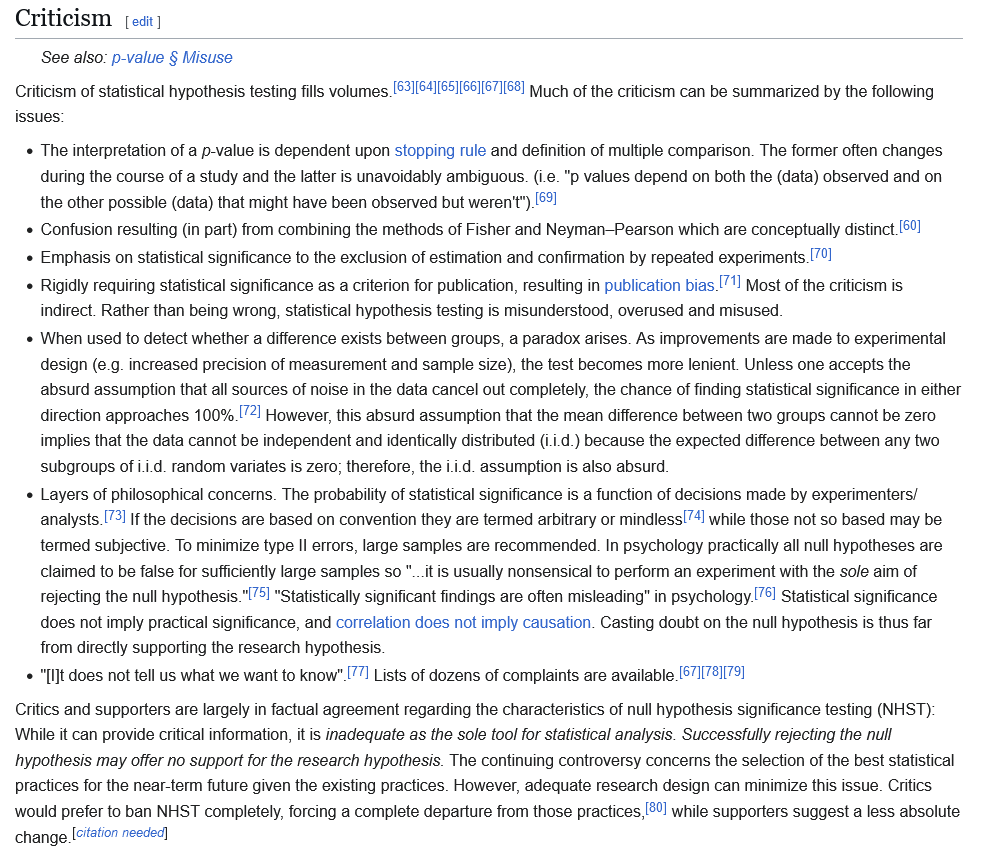
Mindless statistics (Gigerenzer 2004) is a paper recommended by Richard Hahn that is an excellent read on the topic. (Nuzzo 2014) also provides a detailed breakdown of the limits of statistical significance testing and the common issues with p-values. These include p-hacking, “muddled thinking” (a focus on significance vs effect size), and “false alarm probabilities”. There is also mention of how p-values represent the probability of observing data given a null hypothesis, whereas we usually want the probability of a hypothesis given the observed data! Hello Bayesians! Another worthwhile read.
Finally, our goal is to show how to display data and model outputs in interesting ways.
Following this link.
suppressMessages(library(DT))
ip = as.data.frame(installed.packages()[,c(1,3:4, 16)])
ip = ip[is.na(ip$Priority),c(1:2,4),drop=FALSE]

datatable(ip,
  filter = "top",
  options=list(width=600),
  rownames=T
)Movies are generally better than their book counterparts.